Every engagement ends with something you can use without us: working code in your repository, tests that run on their own, and documentation your team can read. Here is what each service covers, how to tell you need it, and what you get at the end.
Fig. 1Most engagements start around a table with printouts, before anyone writes code.
01
Data strategy and architecture
Decide what to build, in what order, and why, before anyone signs a contract for a new tool.
Fig. 2A target architecture is a drawing first and a plan second.
Signals you need it
Several teams keep their own copies of the same data.
A platform decision is pending, and nobody can compare the options on equal terms.
Leadership asks for a data roadmap and receives a list of tools.
Costs grow faster than the number of people using the data.
Typical activities
Interviews with the people who produce and use data.
An inventory of sources, pipelines, reports, and owners.
A current-state diagram and a target architecture.
Options compared on cost model, team skills, and risk.
Deliverables
Current-state and target architecture diagrams.
A sequenced roadmap with effort ranges.
A decision record for each major platform choice.
02
Data engineering and pipelines
Move data from the systems that create it to the place you analyze it, on time and without manual steps.
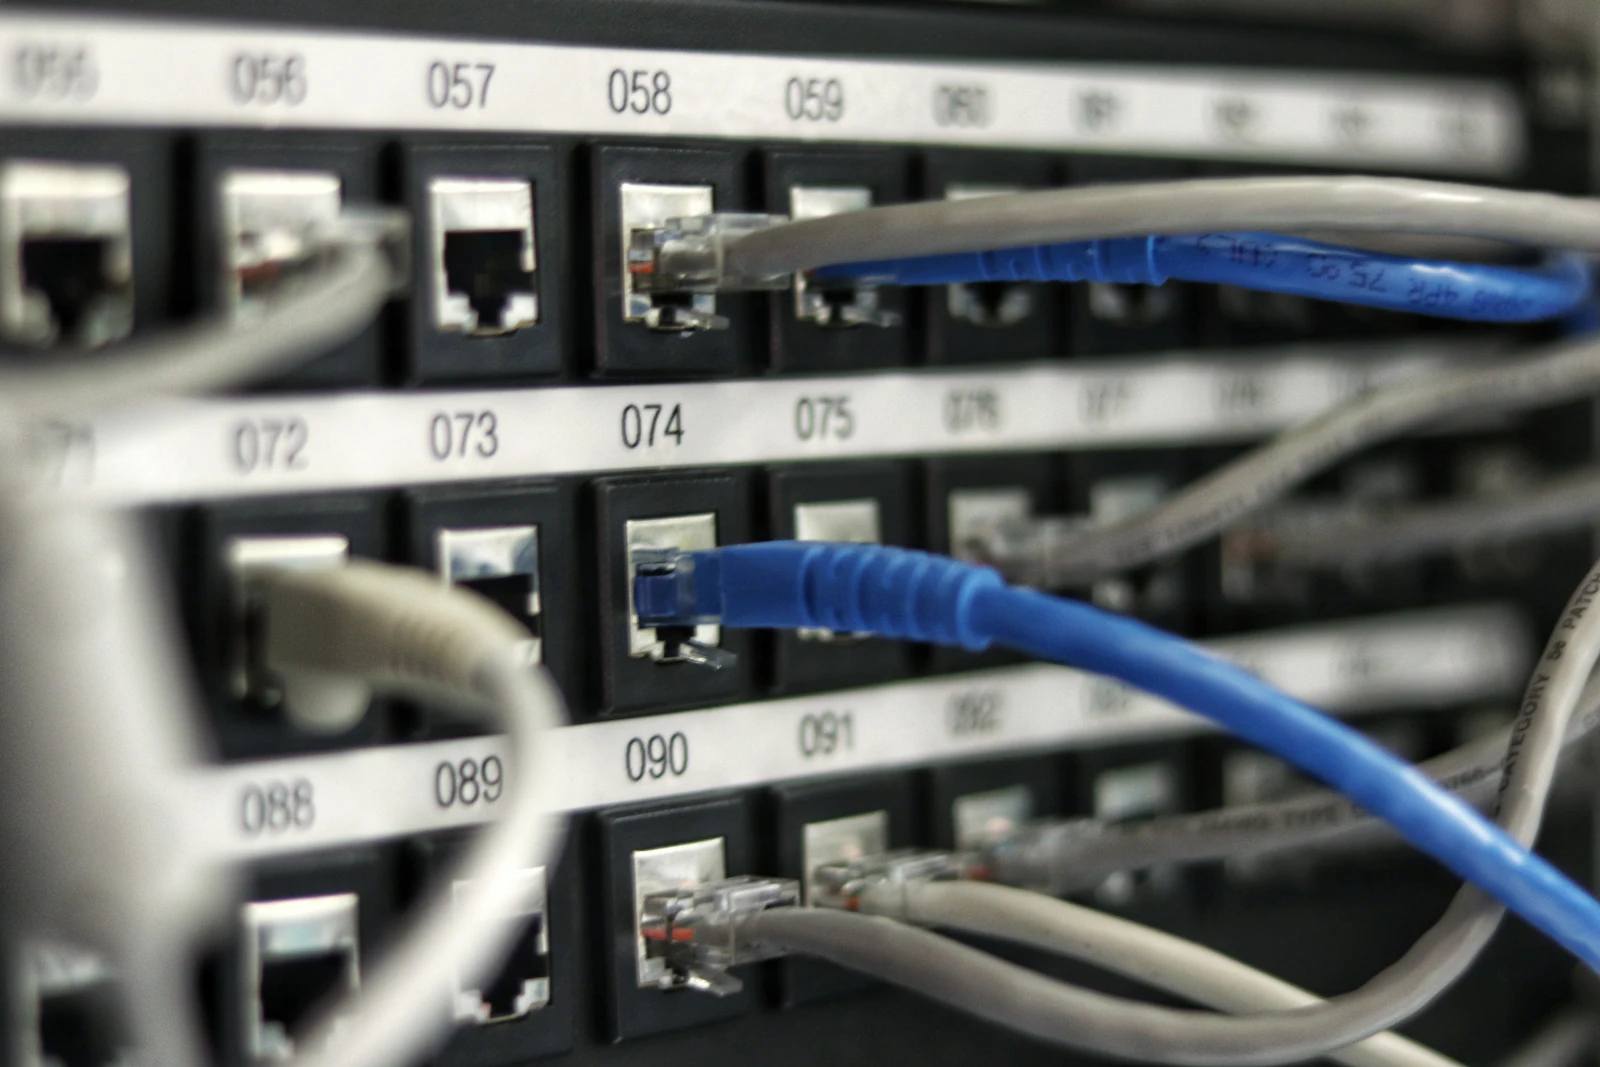
Fig. 3Every connection should be labeled, monitored, and owned.
Signals you need it
Someone exports files by hand to keep reports current.
Loads fail silently, and a stale dashboard is the first alert.
A column renamed in a source system breaks reports downstream.
Near-real-time needs are being met with ever-shorter batch schedules.
Typical activities
Batch and change-data-capture ingestion from databases, SaaS tools, and files.
Orchestration with dependencies, retries, and alerts.
Freshness and volume checks on every load.
Infrastructure defined as code and kept in version control.
Deliverables
Production pipelines with monitoring and alerting.
A runbook for each pipeline: what it does, how it fails, how to fix it.
A source inventory with owners and expected freshness.
03
Analytics engineering and modeling
Turn raw tables into clean, documented models that apply each business rule once, in one place.
Fig. 4The logic in a well-loved spreadsheet usually belongs in a tested model.
Signals you need it
The same metric is calculated differently in different reports.
Business logic lives in spreadsheet formulas and dashboard filters.
New analysts take weeks to learn which tables to trust.
Simple questions need a custom query every time.
Typical activities
Layered models: staging, intermediate, and marts.
Facts and dimensions at a clearly stated grain.
Tests on keys, relationships, and accepted values.
Version control, code review, and automated deployment for SQL.
Deliverables
A tested model layer for your core business processes.
A data dictionary with plain-language definitions.
A contribution guide so your team can extend the models.
04
BI and dashboards
Fewer dashboards, each with a purpose, an owner, and numbers that match the ones in the next meeting.
Fig. 5A dashboard earns its place when someone reads it every week.
Signals you need it
There are more dashboards than regular readers.
Meetings start with a debate about whose numbers are right.
Dashboards load slowly or time out at month end.
Nobody knows which reports can be retired.
Typical activities
A usage review of existing reports and dashboards.
Shared metric definitions in a semantic layer or model.
Dashboard designs that lead with the question they answer.
Performance tuning and access by role.
Deliverables
A core set of dashboards built on governed models.
Metric definitions shown next to the numbers.
A retirement list for duplicate and unused reports.
05
Data quality and governance
Know when data is wrong before your stakeholders do, and know who fixes it.
Fig. 6Governance is a catalog people can find things in, with a name on every drawer.
Signals you need it
Data problems are reported by the people reading reports.
Nobody owns the key tables, so fixes stall.
Definitions live in people's heads or in old slide decks.
Sensitive fields are visible to more people than they should be.
Typical activities
Checks for freshness, volume, uniqueness, missing values, and business rules.
Ownership for critical tables and metrics.
A business glossary and documented lineage.
Access reviews and handling rules for sensitive fields.
Deliverables
Automated checks with alerts routed to named owners.
A glossary of critical metrics, with definitions and owners.
A data access and handling policy in plain language.
06
AI and machine learning data readiness
Prepare what a model needs from your data: history, labels, permissions, and a record of where every field came from.
Fig. 7Training data starts as rows like these. Readiness is knowing where each one came from.
Signals you need it
An AI or forecasting project is blocked on finding the data.
Training data is assembled by hand for each experiment.
Nobody can say whether customer data may be used for a given model.
Model results cannot be traced to the data that produced them.
Typical activities
A data review for one specific use case.
Feature tables built from the same governed models as reporting.
Dataset documentation: sources, known gaps, and intended uses.
Lineage and versioning so training runs can be reproduced.
Deliverables
A readiness report for the use case, with gaps ranked.
Versioned, documented training datasets.
Access rules for model data, agreed with the data owners.
1
Change data capture is a set of patterns for detecting the rows that changed so that only the changes are moved. Log-based capture reads the database's transaction log rather than querying tables. Back
2
Ralph Kimball and Margy Ross, The Data Warehouse Toolkit, 3rd edition (Wiley, 2013). Back
3
dbt documentation, "Add data tests to your DAG": out of the box, dbt ships with four generic data tests, and a test passes when it returns zero failing rows. Back
4
Timnit Gebru and others, "Datasheets for Datasets," first posted in 2018 and published in Communications of the ACM in December 2021. Back
Engagements usually begin with a two-to-four-week Assess phase.
It produces a written findings report and a prioritized plan, whether or not you hire us for the next step.