Dependable data, clearly explained.

Data engineering & analytics

Flores DataCore, front page

Section A3 Approach

Assess Design Build Enable Operate

Five phases, and each one ends with something you keep.

You can stop after any phase and still own what was built: reports, code, tests, and documentation. Durations below are typical ranges. We confirm them in writing after the Assess phase, once we have seen your systems.

Typical duration by phase, in weeks

  • Shortest typical
  • Longest typical
  1. 01 Assess2–4 weeks
  2. 02 Design2–4 weeks
  3. 03 Build4–12 weeks
  4. 04 Enable2–4 weeks, often alongside Build
  5. 05 OperateOngoing and optional, month to month
Fig. 1Ranges, not promises. Scope, number of sources, and access to people move the numbers.
01

Assess

2–4 weeks

We interview the people who produce and use your data, list every source, pipeline, and report in scope, and trace a few of your most important numbers from the dashboard back to the source system. Tracing one number end to end shows more than any survey.

We read code and configuration. We do not change anything in this phase.

You get
A findings report in plain language; an inventory of sources, pipelines, and reports; a prioritized list of fixes with effort ranges; and a recommendation for what to do next, including when the answer is "nothing yet."
We need
Read-only access to the systems in scope and about an hour each with the people who build and use the reports.

Team arranging sticky notes on a glass wall during a workshop
Fig. 2Mapping who uses which report, one note at a time.
02

Design

2–4 weeks

We design the target architecture and the core data models: the grain of each table, its keys, and the definition of every metric that matters to the business. Platform choices are written up as decision records with the trade-offs stated.

The plan is sequenced by value, so the first increment answers a question someone is already asking.

You get
Architecture diagrams, model specifications, decision records, and a delivery plan with effort ranges.
We need
A business owner for each subject area who can settle definitions, such as what counts as an active customer.
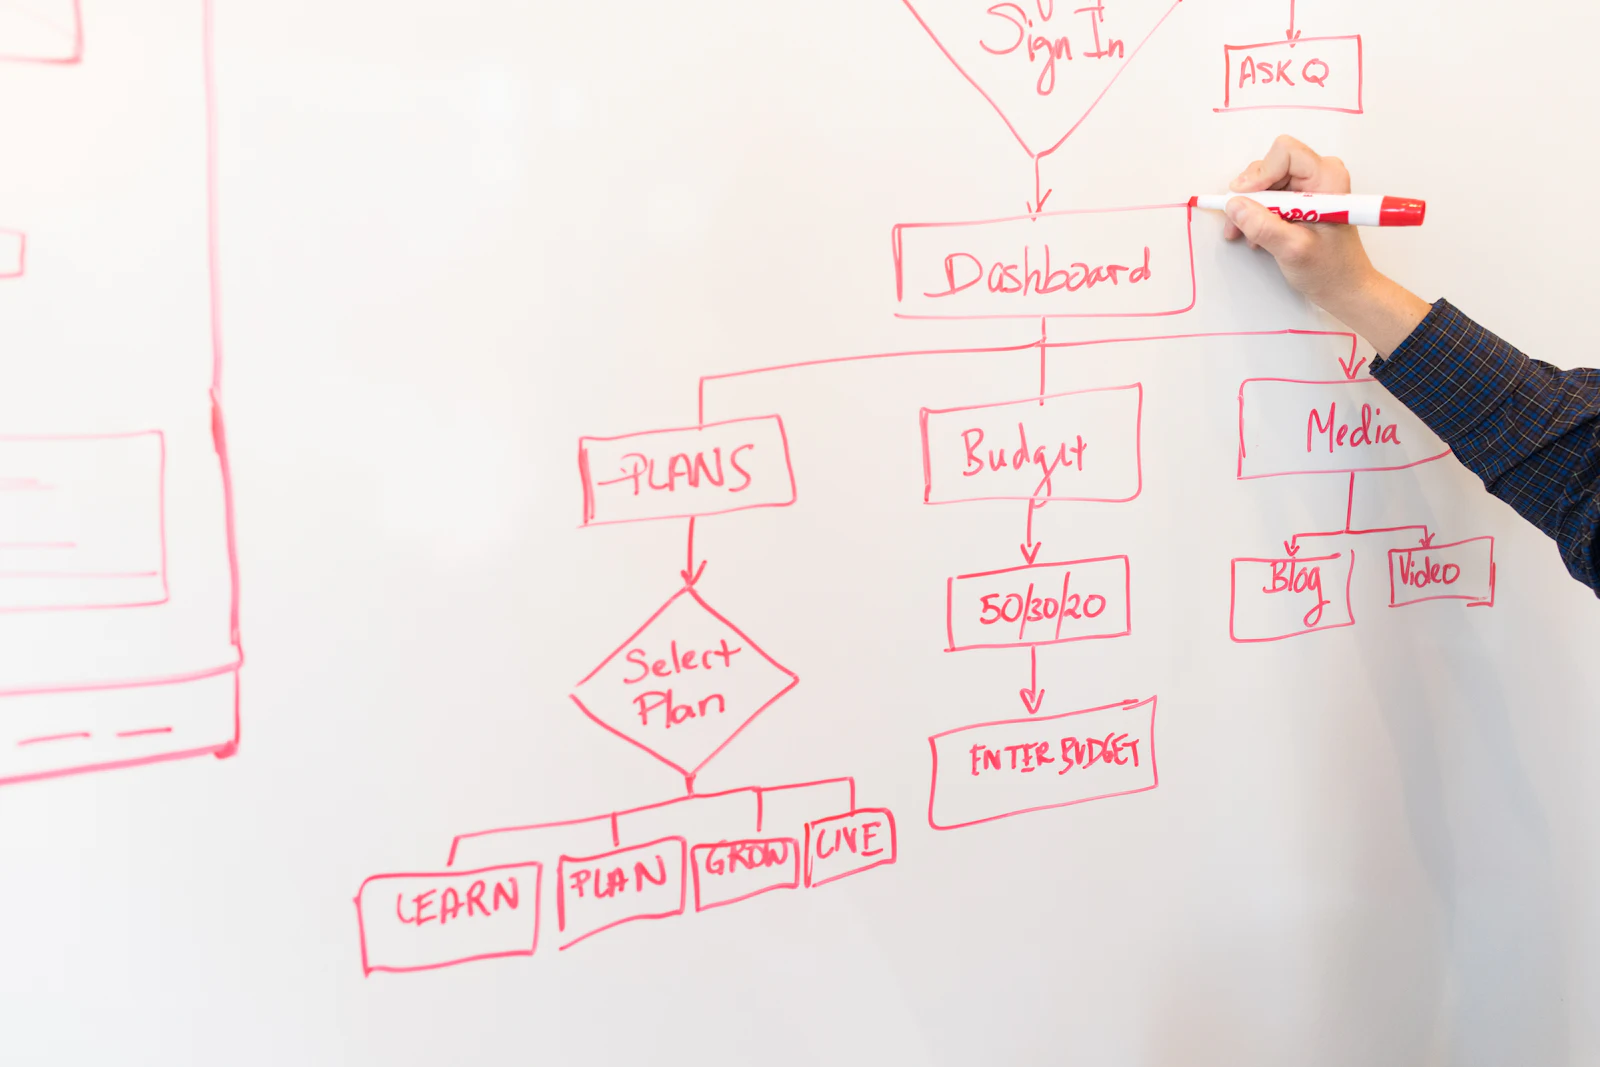
Flowchart sketched in red marker on a whiteboard
Fig. 3Boxes and arrows first. Tables and code follow.
03

Build

4–12 weeks

We build pipelines, models, tests, and dashboards in increments of one to two weeks. Each increment ends with a working review: the people who will use the output try it on real data and tell us what is wrong.

Everything lives in your accounts and your repository from the first day.

You get
Production pipelines and models, automated tests and alerts, the agreed dashboards, and documentation kept next to the code.
We need
Someone on your side to review changes and approve releases.
Labeled network patch panel with connected cables
Fig. 4Built to be read later: labeled, numbered, and documented.
04

Enable

2–4 weeks

Your team takes the wheel. We pair on real changes: adding a source, writing a model, fixing a failed load. Runbooks cover the failures we have seen and the ones we expect.

The goal is that your team can run and extend the system without calling us.

You get
Runbooks, a data dictionary, a handover checklist, and working sessions with the people who will own the system.
We need
Time on the calendar for the people taking over.
Two people working through handwritten notes beside laptops
Fig. 5Handover happens side by side, on real changes.
05

Operate

Optional, monthly

If you want a hand after handover, we monitor the pipelines, respond to failures during agreed hours, make small changes, and review cost and usage with you each quarter.

It runs month to month. You can end it at any time and keep everything.

You get
A short monthly report: incidents and their causes, changes made, and cost trends.
We need
An agreed list of what we watch, and who to call when something breaks.
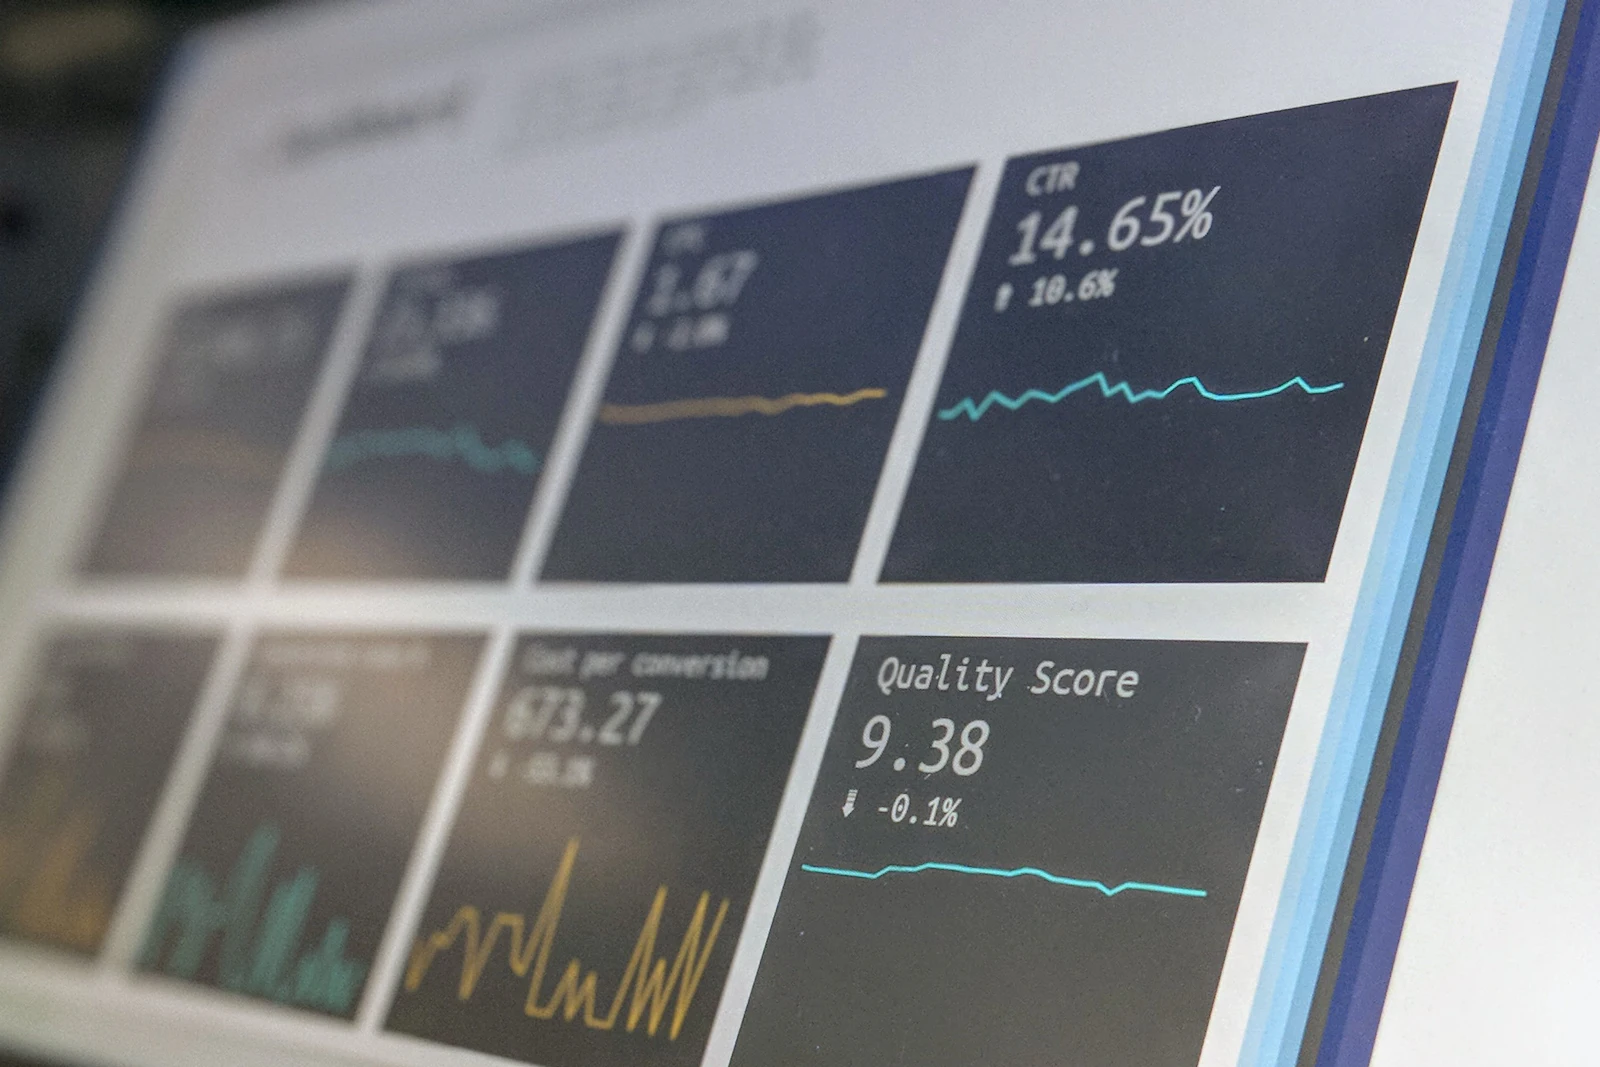
Monitor showing a dashboard of metric tiles with trend lines
Fig. 6Operating means watching the numbers about the numbers.

A3.1Lineage map

Every number has an address. Here is a typical one.

This is the kind of lineage map we draw in the Design phase and keep current in Build. Hover, tap, or tab to any step to see what it depends on and what depends on it. Arrow keys move between steps.

  1. Sources: app database, CRM, billing system, product events, budget sheets
  2. Ingestion: change capture, batch connectors, event stream, file loads
  3. Staging: orders, customers, payments, events, budget
  4. Models: fct_orders, dim_customers, fct_sessions, fct_budget
  5. Marts: finance, growth, product
  6. BI and ML: revenue dashboard, revenue forecast, retention dashboard, churn features

Trace a step Pick the revenue dashboard to see every step it depends on, or the app database to see how far one source reaches.

  • Selected step
  • Upstream: what it depends on
  • Downstream: what depends on it
Fig. 7A fictional company with five sources, four ingestion paths, and four uses. Real maps are larger; the principle is the same.
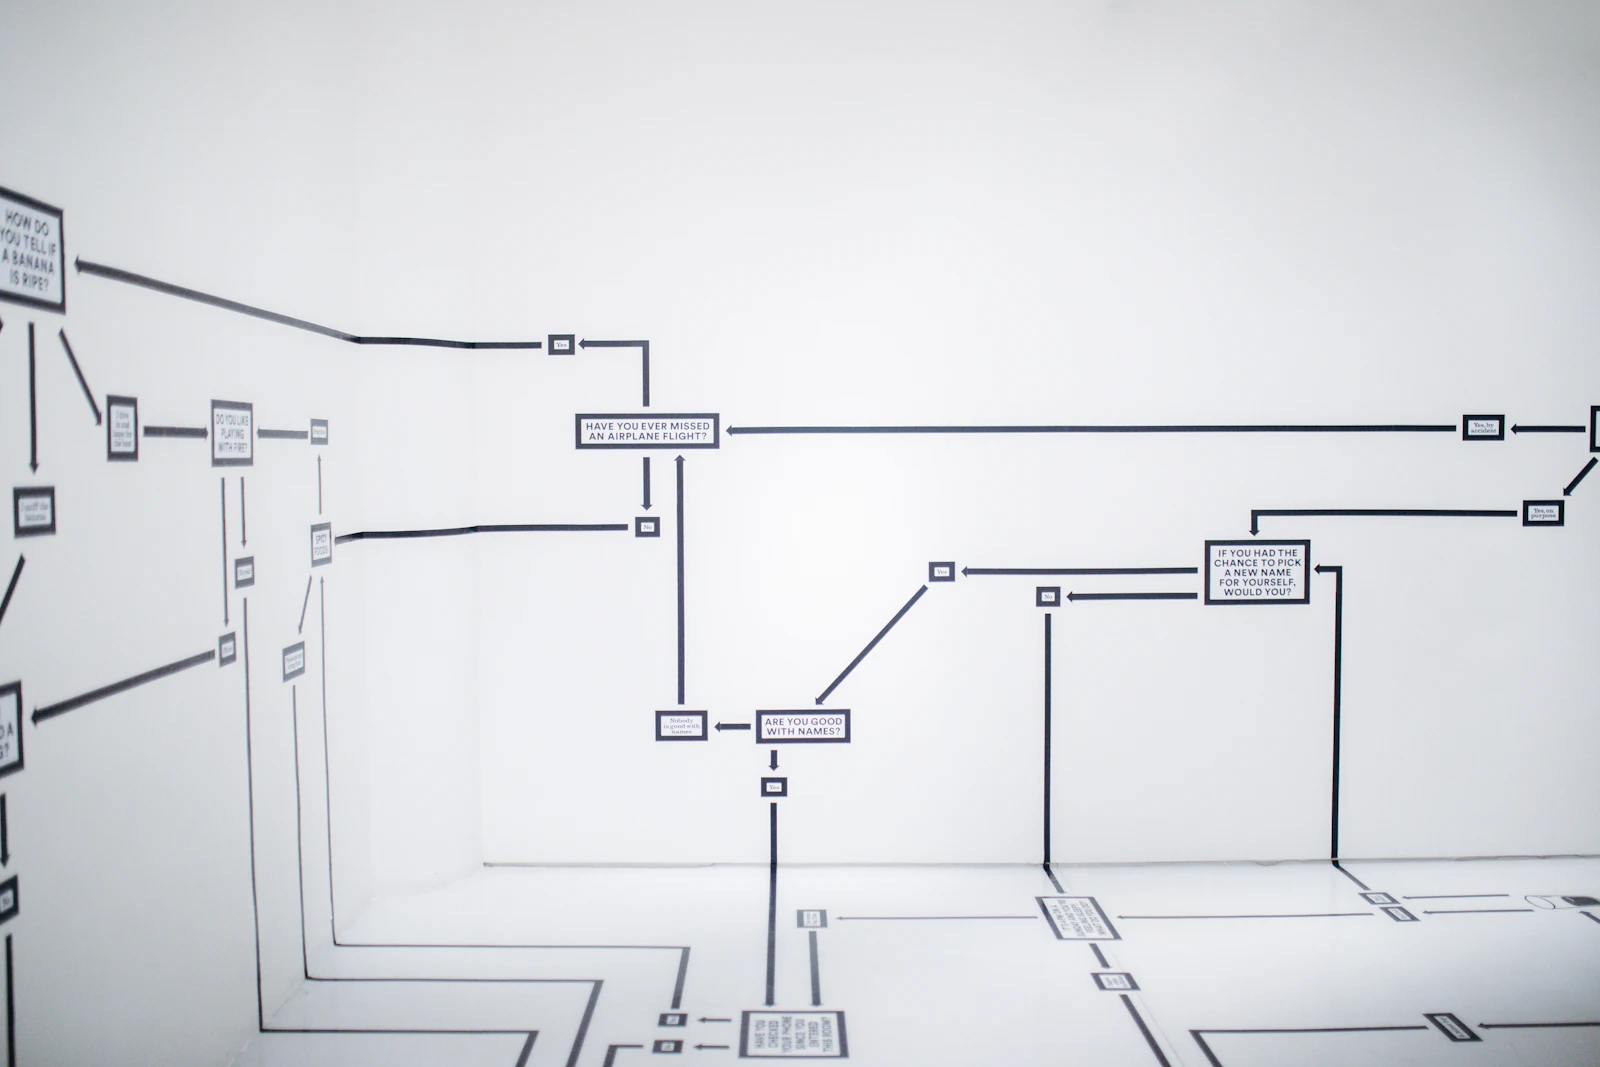
Decision flowchart of boxes and arrows taped across a gallery wall
Fig. 8Lineage is a flowchart someone keeps up to date.

Before a change

Renaming a column in the billing system? The map shows which models, dashboards, and forecasts will feel it, before anyone ships the change.

After a failure

When a load fails, the map shows which reports are now stale, so you can tell their readers before they notice.

During an audit

When someone asks where a reported figure came from, the answer is a path you can show, not a meeting.

When planning AI work

A model trained on churn features inherits every problem upstream of them. Lineage tells you which sources it actually depends on.

A3.2Clearly explained

How we explain a query to the people who rely on it.

Every model we hand over is plain SQL, and we walk through it line by line. Hover or tab to each clause to see which rows and columns it touches, or play the clauses in the order the database evaluates them.1

revenue_by_region.sql
SELECT region,
       COUNT(*)    AS orders,
       SUM(amount) AS revenue
FROM   fct_orders
WHERE  status = 'complete'
  AND  order_date >= DATE '2026-01-01'
GROUP BY region
HAVING SUM(amount) > 1000
ORDER BY revenue DESC;

Ready Select a clause. The source table is on the right, and the result is below it.

Source: fct_orders, 12 rows

order_idregionstatusorder_dateamount
5001Eastcomplete2026-01-08420.00
5002Westcomplete2026-01-11610.00
5003Eastrefunded2026-01-14180.00
5004Southcomplete2026-01-19240.00
5005Eastcomplete2026-02-02760.00
5006Northcomplete2026-02-05980.00
5007Westcomplete2026-02-09530.00
5008Southcomplete2025-12-28900.00
5009Northpending2026-02-15300.00
5010Southcomplete2026-02-21310.00
5011Northcomplete2026-02-24150.00
5012Eastcomplete2026-03-0295.00

Result, 3 rows

regionordersrevenue
East31275.00
West21140.00
North21130.00
  1. 1

    SQL is written starting with SELECT, but the logical processing order is FROM, WHERE, GROUP BY, HAVING, SELECT, and ORDER BY. Microsoft's SELECT reference for SQL Server lists this order; the physical execution plan can differ. Back

A3.3House rules

Rules we follow in every phase.

  1. 1

    Your accounts, your repository.

    Everything we build lives in systems you own and control from the first day.

  2. 2

    Tests before dashboards.

    A number goes on a dashboard after the model behind it has tests.

  3. 3

    Plain language.

    Every model, metric, and runbook is documented in sentences a new hire can follow.

  4. 4

    No surprise tools.

    We do not resell licenses, and we recommend a paid tool only with its trade-offs written down.

  5. 5

    Smallest useful increment.

    We ship something people use within the first weeks of Build, then improve it.

  6. 6

    Leave it better documented.

    If we touch it, we write down what it does and who owns it.

Start with an Assess phase and decide from there.

Tell us which numbers matter most and where they come from. We reply by email with questions and a proposed scope.